
Ignite UI Geographic Map
The Ignite UI for JavaScript Map component brings the ability to visualize geographic data to your application. It can render data sets consisting of many geographic locations in shapes of markers, lines, polygons, or even interactive bitmaps. The Map component includes the ability to overlay multiple map layers with geographic data (including data from providers like Bing and Open Street), enabling you to mark specific geographic locations and display information using custom markers and colors.
View Sample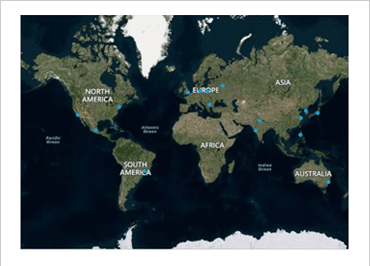
Bing/Open Street Maps
The Ignite UI for JavaScript Map makes overlaying your map with imagery tiles from Open Street and Bing very easy. You can choose an aerial view, roads, or aerial with labels.
View Sample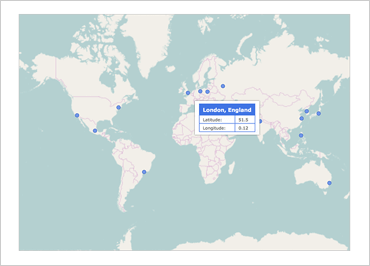
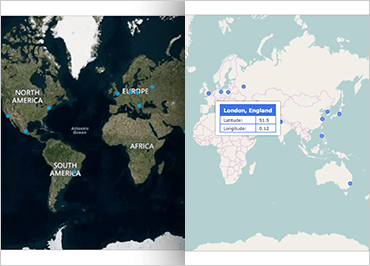
Custom Map Tooltips
Adding Custom Tooltips to your Ignite for JavaScript UI Map component is an easy and intuitive way to provide your users with important information at a glance. You just provide an HTML-based template and a list of data and Ignite UI for JavaScript’s Map component will take care of the rest.