
Ignite UI Grids and Lists
Designed for the modern web – high-performance, touch-friendly and responsive design – our JavaScript/HTML5 grids deliver on your enterprise business needs.Key Features
- Column fixing, resizing, hiding, fixing, and summaries
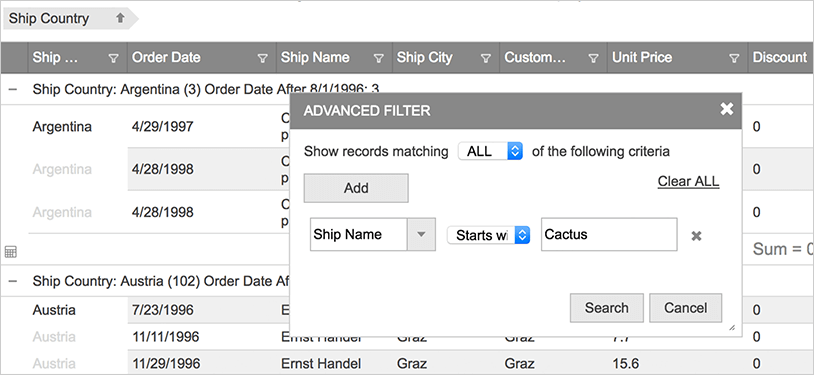
- Data editing, grouping, sorting, filtering, and paging
- Multi-row Layout, visual and physical cell merging, multi-column headers, column groups
- Many databinding options, including JSON, XML, and HTML, with binding to local, remote, or live streaming data
- Complete support for Angular, React, Angular JS, KnockoutJS, and Microsoft MVC
Data Grids for Every Scenario
We don’t lock you in to a single data display – Ignite UI for JavaScript includes a grid for flat data display, hierarchical master-detail, hierarchical tree-lists, and even support for multi-dimensional OLAP data.
Flat Data
Ignite UI for JavaScript includes the fastest HTML5 JavaScript grid on the market. Bind to a variety of data sources including JSON, XML, HTML tables, .NET collections, and even .NET DataTables. The HTML5 grid works with popular open source libraries, including Angular JS, KnockoutJS, History.js, JsRender, and Bootstrap. It includes the features you expect – data editing, sorting, filtering, grouping, column fixing, column resizing, column summaries, data templates, paging, load-on-demand, and a lot more.
View Sample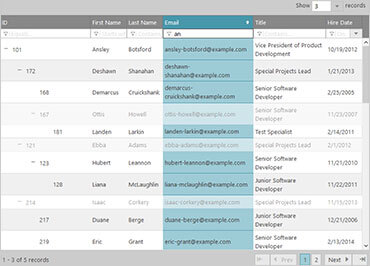
Tree Grid Data
The HTML5 Tree Grid component presents hierarchical data by combining the principles of a tree and tabular data into a single control – with rollup summaries, sorting, filtering, grouping, paging, column fixing & hiding, and more. The tree grid presents hierarchical data similar to the Ignite UI for JavaScript hierarchical grid control–but the tree grid displays data all in the same columns. Perfect for financial applications like balance sheets, or any data scenario that requires roll-up columns or hierarchical data displayed in fixed columns. The tree grid supports line-of-business features like data editing, sorting, filtering, paging, column fixing, column hiding, multi-column headers and more.
View Sample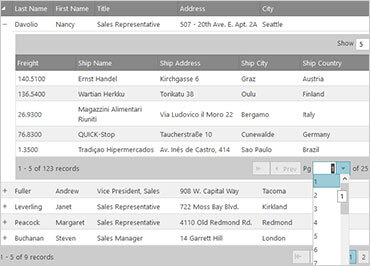
Hierarchical/Master Detail Data
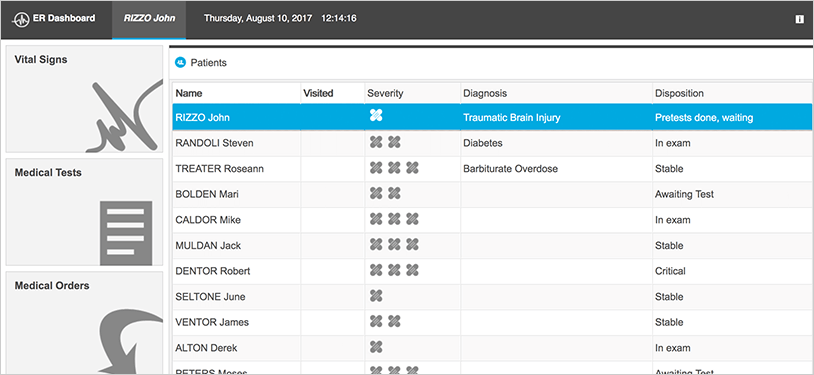
Built on top of the flat data grid, the HTML5 hierarchical grid delivers on master-detail displays with no compromises. Bind the hierarchical grid to a variety of data sources including JSON, XML, .NET collections, and even .NET DataSets. Use load-on-demand to deliver any amount of data to client. Included are interactions that you need for your enterprise apps – data editing, sorting, filtering, column resizing, column summaries, paging, and more.
View Sample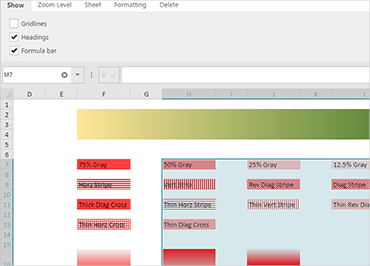
Spreadsheet
The Ignite UI Spreadsheet component provides your users with a powerful yet familiar way to manage data. The Spreadsheet component can import and export data from Microsoft Excel (both locally and remote) and supports most of the Excel objects. All data formatting is supported, so what your user sees in Excel is what they will see in your web application and vice versa, including colors, fonts, grid lines, headings, and text/data formatting. The Spreadsheet component supports all of Microsoft Excel’s built- in formulas (Sum, Average, Mean, Median, etc.) so your calculated data will always be available.
View Sample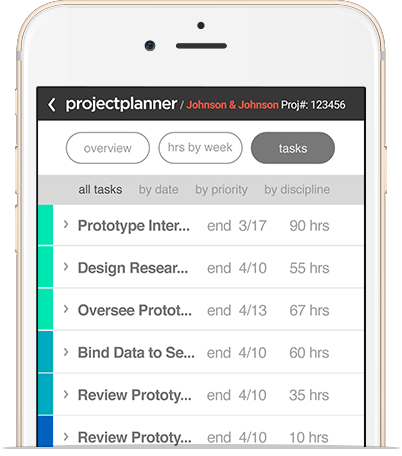
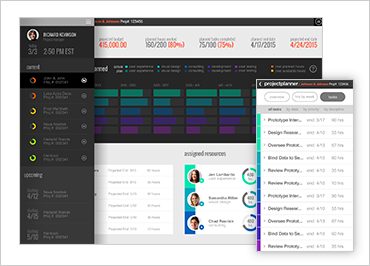
Designed for the Modern Web
Deliver mobile-first and touch-first experience to your customers out of the box. Designed for modern touch and responsive web, you can feel safe building apps that run on any device size. Use the Ignite UI Layout Manager, Tile Manager, Splitter, or even Bootstrap to build responsive, beautiful applications with a wide variety of built-in customizable themes.
Databinding with AngularJS, KnockoutJS or Microsoft MVC
With Angular, we are committed to ensuring that Ignite UI delivers Angular support inherently. All Ignite UI controls have component definitions with Angular and are hosted on GitHub.
Use our Angular JS directives to declaratively build your next JavaScript & HTML-based MVC app. Our directives housed on GitHub give you full, two-way databinding and clean Angular integration.
Our KnockoutJS support delivers dependency tracking, templating, and automatic UI refresh using Knockout’s easy mapping of DOM elements to your data model.
Get the full power of Visual Studio with our MVC components. Use the most powerful IDE in the world and your C# expertise to build complete, modern web experiences.
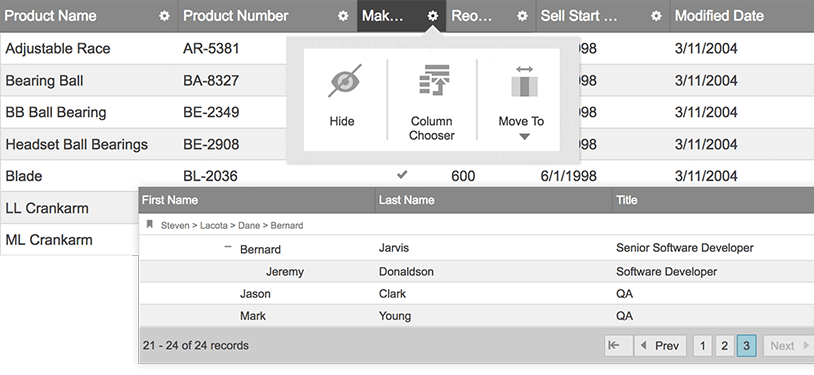
Rich Data Interactions
Give your users the interaction experience they expect, such as prioritizing data visibility with a fixed column or collapsing groups of data. Features like data entry, grouping, sorting, paging, filtering, column templates, column fixing, collapsible column groups, and more are available in the grid components.
Flexible Layout for Responsive Design
Customize column layout based on screen size with our built-in responsive design features. This feature lets you hide columns, template columns, and change the entire data display based on the device screen size.
View Sample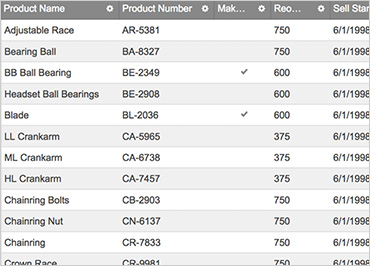
High-Performance, High-Volume Data
Built-in DOM virtualization and paging features allow you to expose thousands of records in no time. Load your data on demand from your backend services to minimize loading time for your applications and to bring a premium user experience to your customers.
View SampleLocal and Remote Data Access
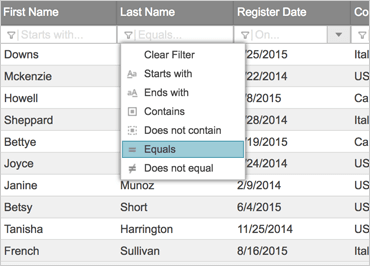
Work with any data source – local XML, JSON, HTML table, or a remote web service. Utilize client- and server-side sorting, filtering, paging, summaries and grouping for your data. Allow your customers to easily find what they are looking for.
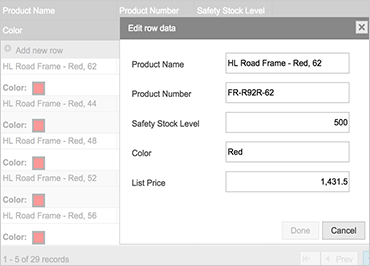
Efficient Data Entry
Edit multiple records and save them all at once with the batch editing feature. Or, edit data inline within the cell using templates with custom editors that match the column’s data type. This allows for adding new rows and deleting rows within the grid. Validations can also be done real-time within the grid cell. These, and many more functionalities enrich the performance of your applications.
View Sample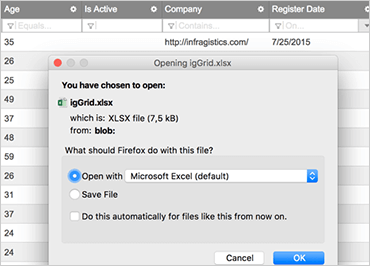
The Power of Excel without Excel
Use our full-featured JavaScript Excel library to dynamically create spreadsheets on the client and export the grid to Excel without round trips to the server. You can even export your grids with features like sorting, filtering, summaries, hidden columns, and more.
View SampleOLAP Pivots
Overview
The OLAP Pivot components include a Pivot Grid, Pivot Data Selector, and Pivot View, which enable you to perform in-depth, multi-dimensional data analysis and read OLAP data. The components can be used with flat tables or XMLA data sources for delivering high data presentation quality.
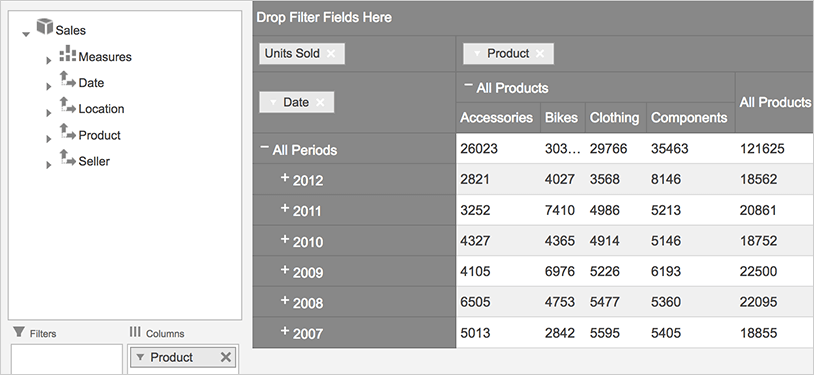
OLAP Support
Combining a Pivot Grid and Data Selector, the Pivot View component provides the tools users need to manipulate multidimensional data in one place. As part of the Business Intelligence category, the Online Analytical Processing (OLAP) approach allows for visualizing multi-layered analytical and ad hoc queries with a swift execution time.
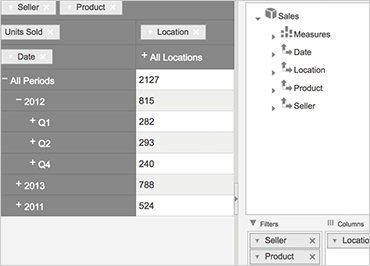
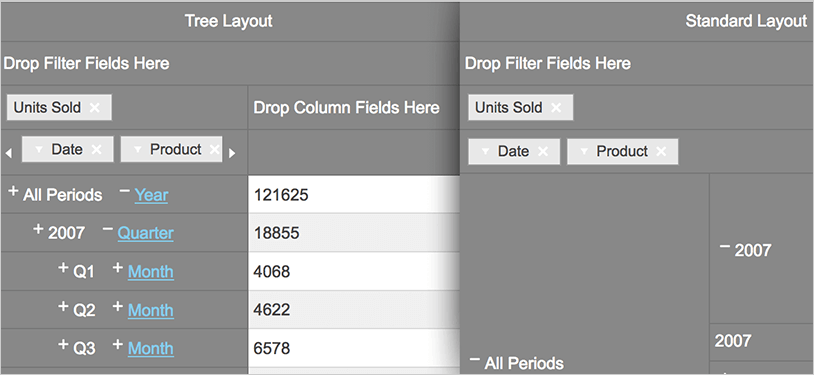
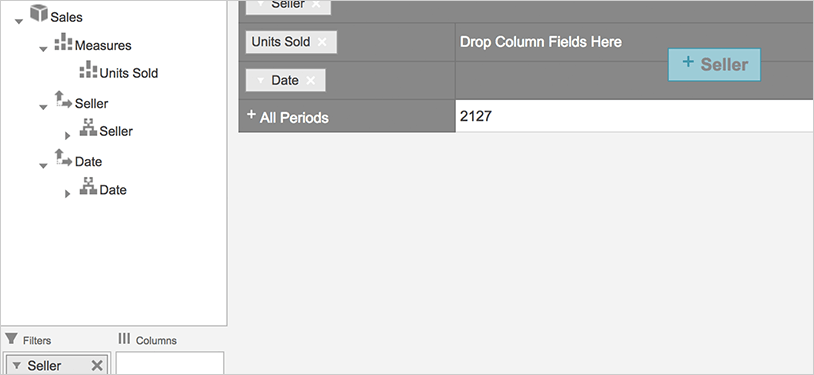
View SampleData Arrangement & Multiple Layouts
Use hierarchies as columns, rows, or filters and choose among multiple layout modes, depending on how much space you have.
View Sample
Get started today. Download a 30 day free trial with standard support included.
Download Trial