

Windows Forms Charts
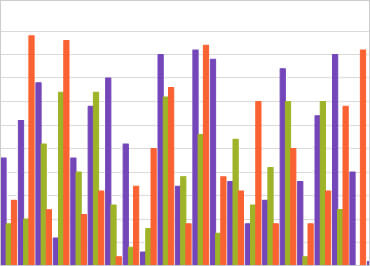
Windows Forms Category Chart
Built with the power of the industry’s best data chart, the lightweight Category Chart is easy to configure using a simple and intuitive API.
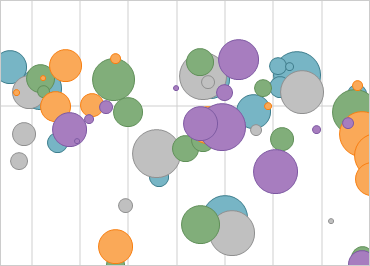
Windows Forms Chart
Create rich charts with less code. Windows Forms Chart Control renders a broad range of rich, high-fidelity chart types from familiar (bar, line, area, pie, and funnel) to more complex (financial, candle, and radar) charts.
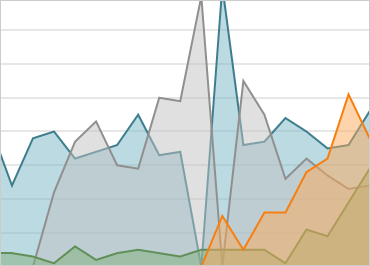
Windows Forms Data Chart
Take full advantage of touch, animate data over time, create composite charts, and use multiple series with our updated Windows Forms Data Chart control.
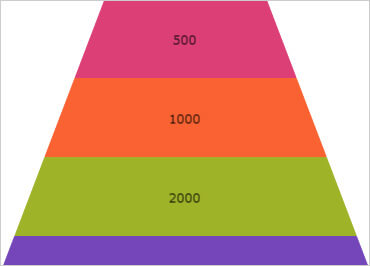
Windows Forms Funnel Chart
Visually showcase diminishing values with the Funnel Chart control, a single-series chart that displays data in a funnel shape with a variable number of sections, each representing the data as different portions of 100%.
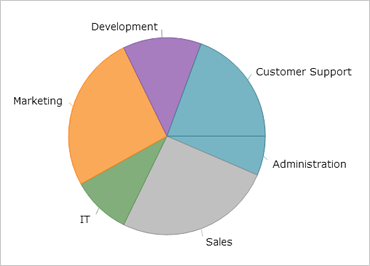
Windows Forms Pie Chart
Create simple or exploded pie charts with a customizable threshold for inclusion in an "Other" category. Text labels and images can be displayed within or outside of the pie in a manner that avoids overlapping.
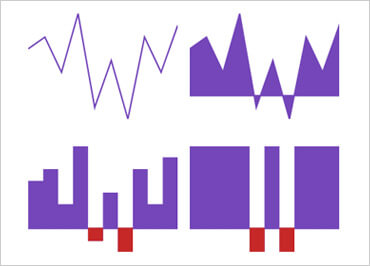
Windows Forms Sparkline
The Windows Forms Sparkline control is a lightweight charting control that can stand alone or render data in a small-scale layout such as a grid cell.
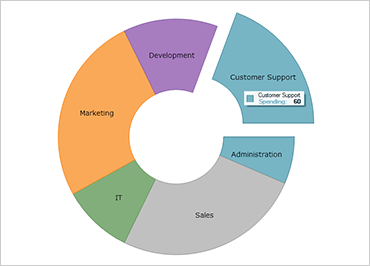
WinForms Doughnut Chart
Express your data with multiple series using this rich Doughnut Chart. Similar to a pie chart, the Doughnut Chart shows categorical statistics expressed in percentages.