

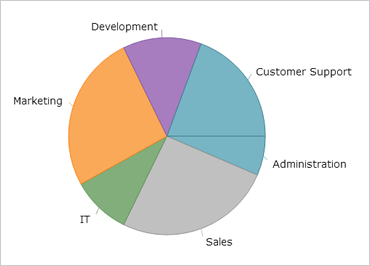
Windows Forms Pie Chart
Create simple or exploded pie charts with a customizable threshold for inclusion in an "Other" category. Text labels and images can be displayed within or outside of the pie in a manner that avoids overlapping. Users can click or drill down to view underlying data, explode out a section of the pie, and find information via tooltips.

Others Category
The “Others” category in the Pie Chart control can be used to group the smaller data values into one slice. Use the drop-down in the Threshold category to select a threshold value and see how the smaller slices are grouped into one slice labeled "Others."

Fully Customizable
Use the Pie Chart control to set the radius factor, the exploded Radius, and the start angle.

Pie Chart Labels
Customize the label extent and label position.