Windows Forms Bullet Graph
Create attractive data presentations with the Bullet Graph control, replacing meters and gauges with clear, simple, straightforward graphs. The Bullet Graph is one of the most effective and efficient ways to present progress towards goals, good/better/best ranges, or multiple measurement comparisons in a compact horizontal or vertical space.
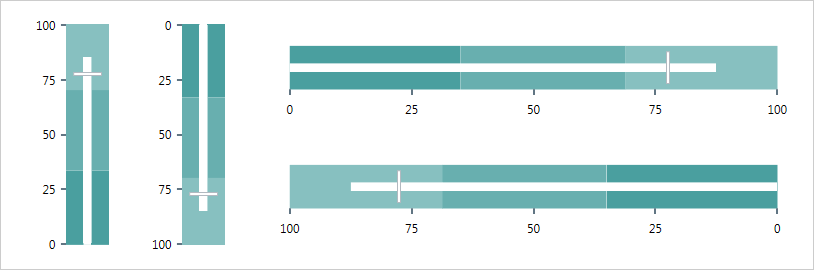
Download Windows Forms SamplesConfigurable Orientation and Direction
Easily switch between horizontal and vertical orientation.
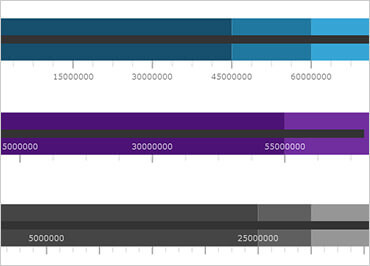
Configurable Visual Elements
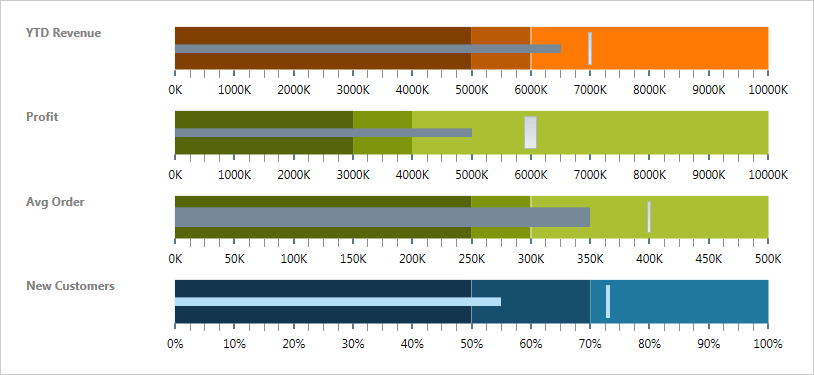
Each of the following visual elements of the bullet graph can be configured in several aspects: performance bar, comparative marker, ranges, tick marks, scale, labels, border, background, and titles.
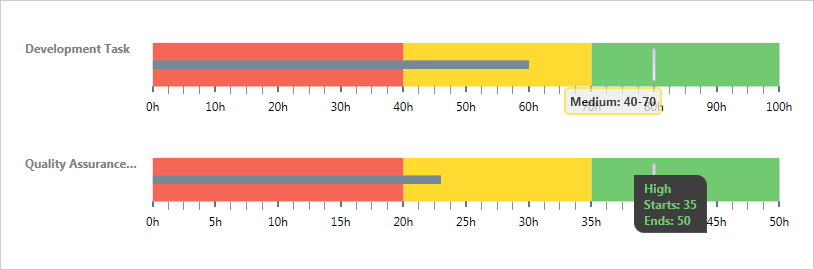
Tooltips
The built-in tooltips of the Bullet Graph control show the values for the performance bar, the target value, or the values corresponding to the different ranges, respectively.