• North American Sales: 1-800-231-8588
  • Global Contacts
  • My Account

Menu
  • North American Sales: 1-800-321-8588
  • My Account
    • Sign In/Register
  • Design & Development
    • Infragistics Ultimate The complete toolkit for building high performing web, mobile, and desktop apps
    • Indigo.Design A Unified Platform for Visual Design, UX Prototyping, Code Generation, and App Development
    • Ignite UI for Angular 50+ Material-based UI components designed and built on Google’s Angular framework
    • Ignite UI for React Features our high-performance data grid and real-time high-volume data charts
    • Ignite UI for JavaScript100+ HTML5 / JavaScript jQuery components with extensions for React, Angular & ASP.NET MVC
    • Ultimate UI for ASP.NET Versatile ASP.NET AJAX UI controls
    • Ultimate UI for Windows Forms 100+ fully featured, Microsoft Office-style UI controls
    • Ultimate UI for WPF UI controls & productivity tools
    • Ultimate UI for Xamarin UI controls & productivity tools
    • All Products
  • UX
    • Indigo.Design Desktop Collaborative prototyping and remote usability testing for UX & usability professionals
    • Indigo.Design A Unified Platform for Visual Design, UX Prototyping, Code Generation, and App Development
  • Business Teams
    • For Business Teams
    • SharePlus Enterprise Mobile workspaces with business processes, collaboration, and data visualization for teams
    • ReportPlus Exceptional analytics on any device
    • ReportPlus Embedded Deliver embedded reports and dashboards in your apps
  • Learn & Support
    • Help & Support Documents
    • Blogs
    • Forums
    • Product Ideas
    • Reference Applications
    • Customer Stories
    • Webinars
    • eBook & Whitepapers
    • Events
  • Free Trials
  • Pricing
    • Product Pricing / Buy Online
    • Renew Existing License
    • Contact Us
 
Windows Forms | Controls
  • Download Trial
Your Privacy Matters: We use our own and third-party cookies to improve your experience on our website. By continuing to use the website we understand that you accept their use. Cookie Policy
Close
  • Grids & Lists
    • Grid
    • List View
    • Pivot Grid
    • Spreadsheet
    • Tree List
  • Charts
    • Category Chart
    • Chart
    • Data Chart
    • Doughnut Chart
    • Funnel Chart
    • Pie Chart
    • Sparkline
  • Barcodes
    • Barcode
  • Data Entry & Display
    • Color Picker
    • Combo Box Editor
    • Editors
    • Extras
    • Form Manager
    • Ink Provider
    • Spell Checker
    • Ultra Radio Button
  • Data Visualizations
    • Gantt View
    • Geographic Map
  • Frameworks
    • Calculation Manager
    • Data Source
    • Documents Framework
    • Excel Exporter
    • Excel Library
    • Flat Data Source
    • Grid Document Exporter
    • Math Library
    • Syntax Parsing Engine
    • Word Framework
    • Word Exporter
  • Gauges
    • Bullet Graph
    • Gauge
    • Linear Gauge
  • Interactions
    • Desktop Alert
    • Printing
    • Peek Pop-up
  • Layouts
    • Carousel
    • Dock Manager
    • Grid Bag Layout Panel
    • Group Box
    • Layout Managers
    • Live Tile View
    • Message Box Manager
    • Panel
    • Splitter
    • Tab
    • Tabbed MDI
    • Tile Panel
    • Zoom Panel
  • Menus
    • Explorer Bar
    • Navigation Bar
    • Notification Badges
    • Office Nav Bar
    • Radial Menu
    • Ribbon Customization
    • Toolbars
  • Scheduling
    • Schedule
  • Styling & Themes
    • AppStylist
WinForms Funnel Chart

Windows Forms Funnel Chart

Visually showcase diminishing values with the Funnel Chart control, a single-series chart that displays data in a funnel shape with a variable number of sections, each representing the data as different portions of 100%. The funnel chart makes it easy for end users to illustrate value “fallout” in the sales process or bottlenecks in the flow of a multi-step process.

A funnel chart displays quantities as percentages of a whole. Funnel charts are commonly used to display quantitative data in relation to stages of a process. For example, a funnel chart might display expenses of a product from the manufacturing stage to the actual sale of that product.

Download Windows Forms Samples
WinForms Funnel chart slice selection

Slice Selection

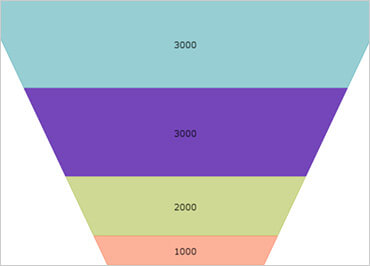
The Funnel Chart allows users to select individual slices of the funnel. This enables your users to interact with the funnel chart in a variety of ways, including firing events that your application can act on.

WinForms Funnel chart Bezier curve

Inverted & Arc Funnel

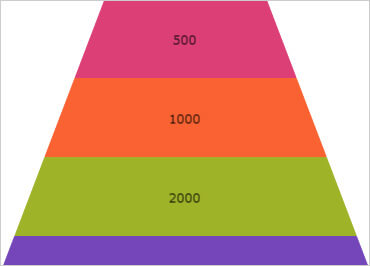
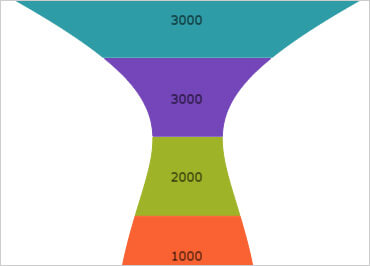
Invert the funnel to display it as a pyramid, or make the funnel sides curve in or out on a Bezier curve.

  • Products
    • Design & Development
    • UX Pros
    • Business Teams
    • View All
    • Free Trials
  • Learn & Support
    • Help & API Docs
    • Blogs
    • Technical Support Chat
    • Forums
    • Product Ideas
    • Submit a Request
  • My Account
    • Manage My Subscriptions
    • Support Requests
  • Corporate
    • About Us
    • Careers
    • Legal
    • News & Events
    • Partners
Stay Up-to-Date

Get the latest blogs, eBooks, events, and whitepapers.

Sign Me Up!
  • Privacy Policy(updated)
  • Cookies
  • Terms of Use(updated)
© Copyright 2019 INFRAGISTICS. All Rights Reserved