
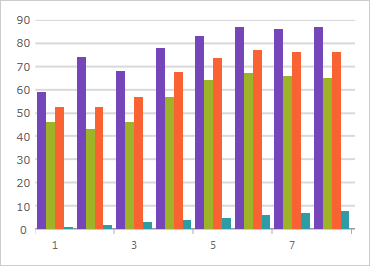
WPF Category Chart
This touch-enabled charting control makes visualizing category data a breeze. Built on top of a high-performing and feature-rich data chart, the category chart filters the complexities of data visualization into a simplified API that anyone can use.
Learn MoreWPF 3D Surface Chart
The 3D Surface Chart control allows fast, visually appealing and customizable 3D surface visualizations. The control offers a full set of API options to achieve any 3D surface plotting requirement and very intuitive defaults to minimize the coding required.
Learn More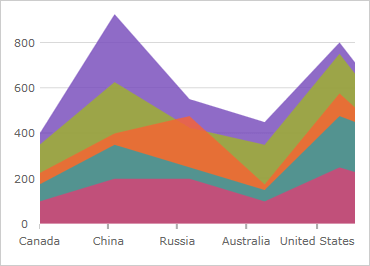
WPF Data Chart
Render WPF charts with millions of data points that are capable of millisecond updates and spare nothing to achieve blazing speed. Enable heavy-duty data visualization and analysis on large volumes of data with high performance.
Learn More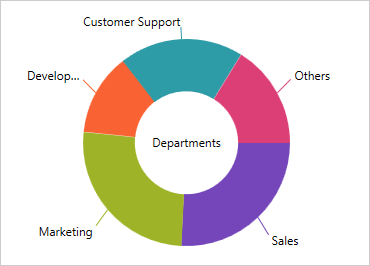
WPF Doughnut Chart
Display your data with multiple series using this rich Doughnut Chart. Similar to a Pie Chart, the Doughnut Chart shows categorical statistics expressed in percentages. With its hollow center, it's best for displaying multiple series using concentric rings where each ring represents a data series. Bind easily to data, configure the inner radius, display exploded slices, customize themes, and more with this well-rounded control.
Learn More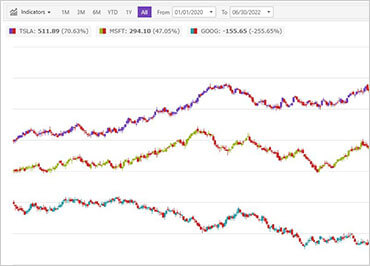
WPF Financial Chart
Easily configure financial data with this lightweight chart for building high-performance, high-volume financial services, and capital market data applications. Just bind your data, and the chart takes care of everything else.
Learn More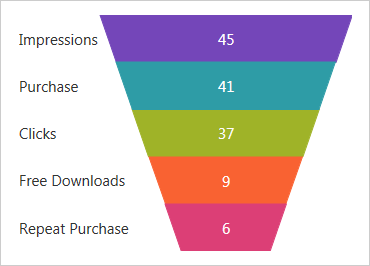
WPF Funnel Chart
Visually showcase diminishing values with our new funnel chart, a single-series chart that displays data in a funnel shape with a variable number of sections, each representing the data as different portions of 100%. The funnel chart makes it easy for end users to illustrate value "fallout" in the sales process or bottlenecks in the flow of a multi-step process.
Learn More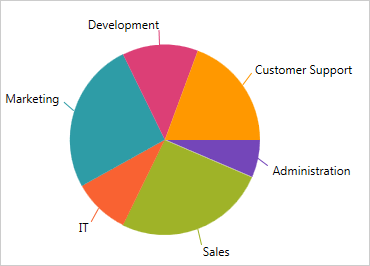
WPF Pie Chart
Create simple or exploded pie charts. Customize the threshold for inclusion in the Other category, and display text labels and images that can be within or outside of the pie in a manner that avoids overlap. Users can click or drill down to view underlying data, explode out a section of the pie, and find information via tooltips.
Learn More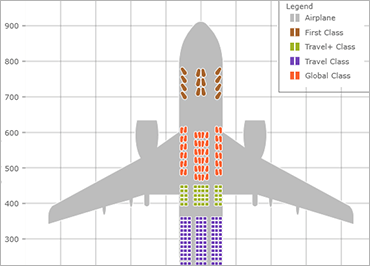
WPF Shape Chart
The WPF Shape Chart plots X/Y data, including break-even data, from shape files or any custom shape you can define. It expands the functionality of the Scatter Chart control with support for two additional data visualizations, Polyline and Polygon. The smart Data Adapter automatically chooses the right visualization for your data, or you can choose from Point, Bubble, Area, Contour, High Density, Line, Spline, Polyline, or Polygon.
Learn More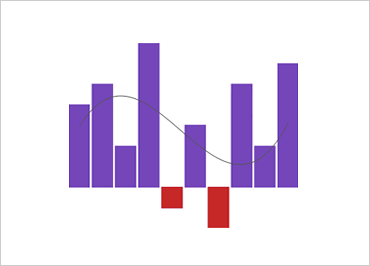
WPF Sparkline
The new Sparkline control is a data-intense, design-simple graphic that allows end users to spot trends, variations, and patterns in data in a clear and compact representation.
Learn More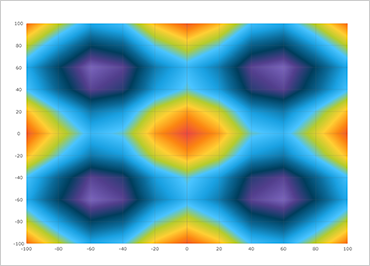
WPF Scatter Chart
The WPF Scatter Chart (available as a CTP control) is a lightweight, high-performance chart that can be easily configured to display scatter data using a simple and intuitive API. Just bind your X/Y data as a collection or a collection of collections, and the chart does the rest. Choose from Point, Bubble, Area, Contour, High Density, Line, or Spline visualizations.
Learn More