

WPF Data Visualizations

WPF Diagramming
Create your own Visio-inspired diagramming solution within your WPF applications with the new xamDiagram control. Easily build flow charts, process diagrams, and other advanced layouts that mimic the familiar Visio interface.
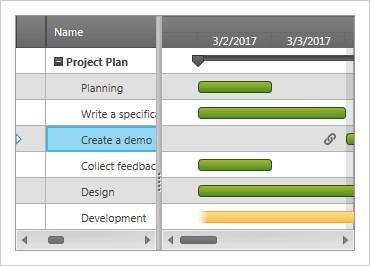
WPF Gantt View
Gantt delivers a Microsoft® Project®-style user experience and best-in-class support for presenting key schedule management concepts like tasks, sub-tasks, dependencies, deadlines, milestones, and more to your users.
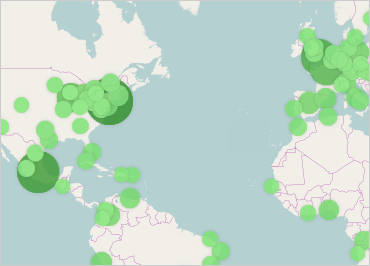
WPF Geographic Map
Create highly-detailed, thematic geographical maps using an innovative feature set that includes: custom shape templates, the ability to render polylines and polyshapes, Map Progression, Scatter Area Plots, an intuitive Overview Pane, and…
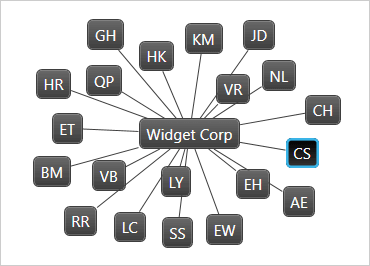
WPF Network Node
Visualize relationships within a network - from biological systems, server infrastructures, and email communication patterns to complex social or professional networks.
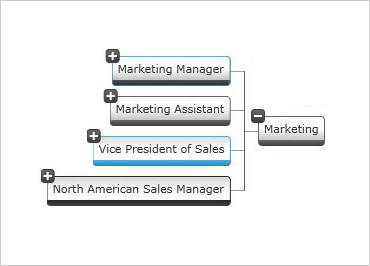
WPF Org Chart
Make sense of organizations visually with high performance, styled WPF org charts that represent a company, department, workgroup or other hierarchical structures.
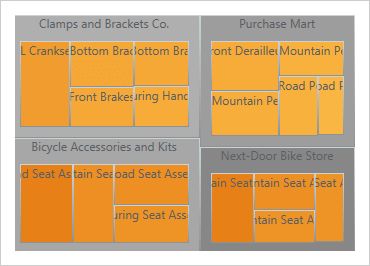
WPF Treemap
Show users the relative weighting of data points at more than one level with WPF treemaps (also known as heatmaps in the financial industry) supporting strip, squarified, and slice-and-dice algorithms.
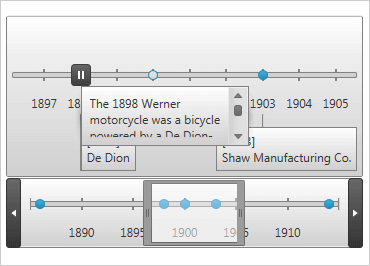
WPF Zoombar
A virtual magnifying glass for WPF application users, xamZoombar embeds itself into charts and timelines so the user can zoom in, zoom out, and pan their view of the data from side to side.