WPF Funnel Chart
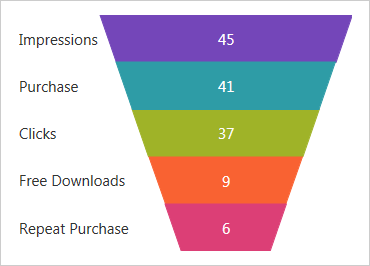
Visually showcase diminishing values with our new funnel chart, a single-series chart that displays data in a funnel shape with a variable number of sections, each representing the data as different portions of 100%. The funnel chart makes it easy for end users to illustrate value "fallout" in the sales process or bottlenecks in the flow of a multi-step process.
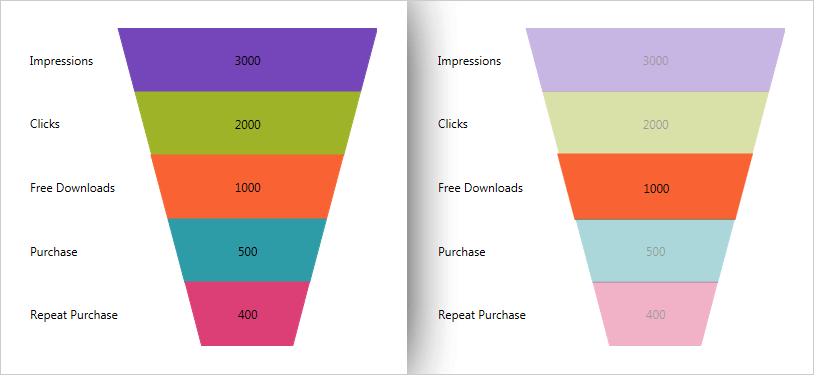
DOWNLOAD WPF SamplesSlice Selection
Receive a notification any time a slice in the funnel is clicked.
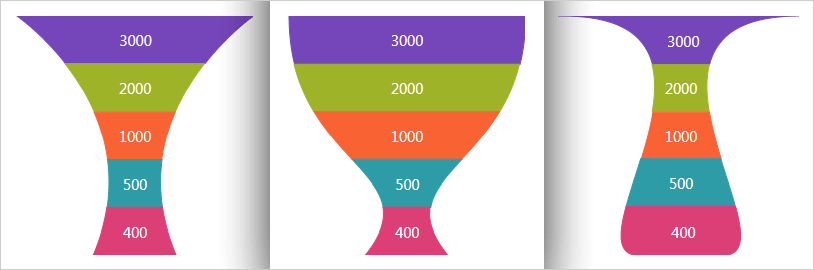
Inverted & Arc Funnel
Invert the funnel to display it as a pyramid, or make the funnel sides curve in or out on a Bézier curve.