WPF Spreadsheet
This Microsoft® Excel®-inspired control allows you to embed Excel document creation and editing experiences right into your WPF applications.
DOWNLOAD WPF SamplesExcel Editing and Formatting
The xamSpreadsheet is built on top of our existing Excel Framework. It provides an interactive control and includes powerful editing and cell formatting features, all without the need for Excel to be installed on the machine.
Full Familiarity
To give your users a seamless experience, the xamSpreadsheet is a pixel-perfect match to Excel. The high-performance spreadsheet has more than 100 familiar keyboard shortcuts, and 150 commands built right in, including pane freezing, named ranges, multiple worksheets, workbook/worksheet protection, and support for over 100 formulas.
Sorting and Filtering
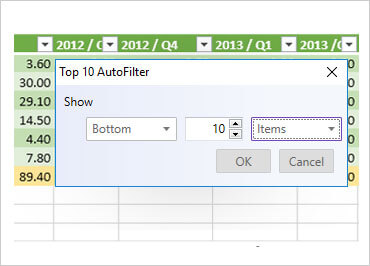
Table and worksheet-level sorting and filtering capabilities let you define and sort or filter an area by text, number, date, or color within a worksheet or outside a table. With the Custom Sort Dialog, Top 10 Filter Dialog, and Format Cells Dialog, you can secondary sort, sort by the top ten (or bottom ten) records, and adjust the way a spreadsheet displays data in a cell. You can also choose from a list of filters or create customized ones.
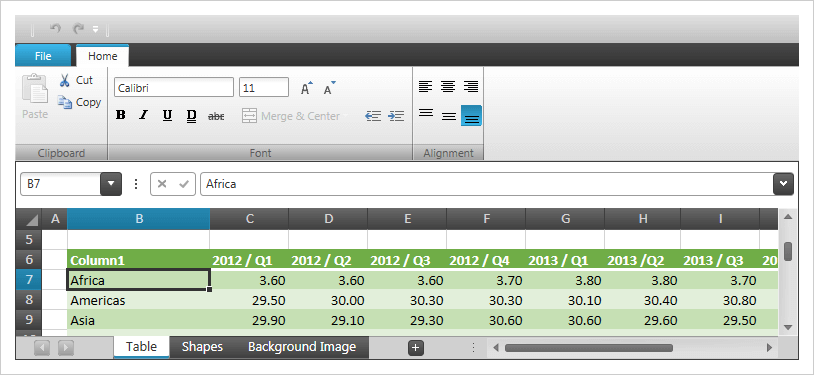
Cell Formatting
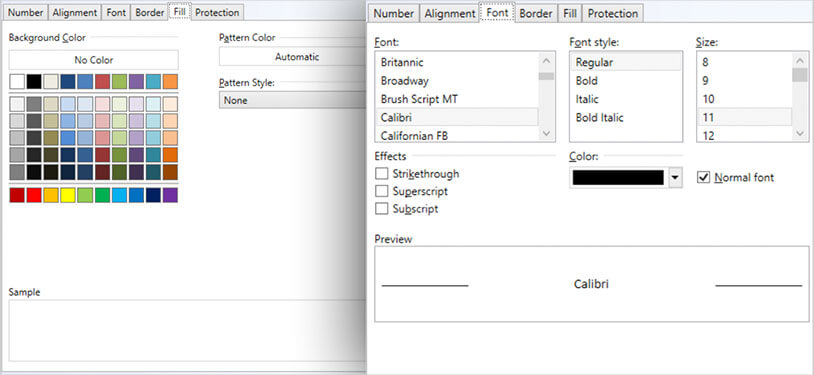
Right-click on a cell to use the Format Cells dialog box to format cell data. Modify number display, alignment, font, shading and borders, and protection of your worksheet data.
Conditional Formatting
Render all the conditional formatting features available in Microsoft Excel, including presets for data bars, color scales with two- or three-color gradients, and icons.
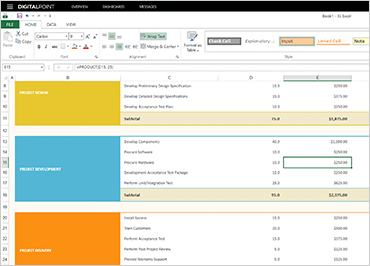
Table Management
Improved controls let you copy and paste entire tables, expand and edit tables, filter and sort table columns, navigate between rows, choose common formulas, and use the context menu to add rows, columns, and data to a table.
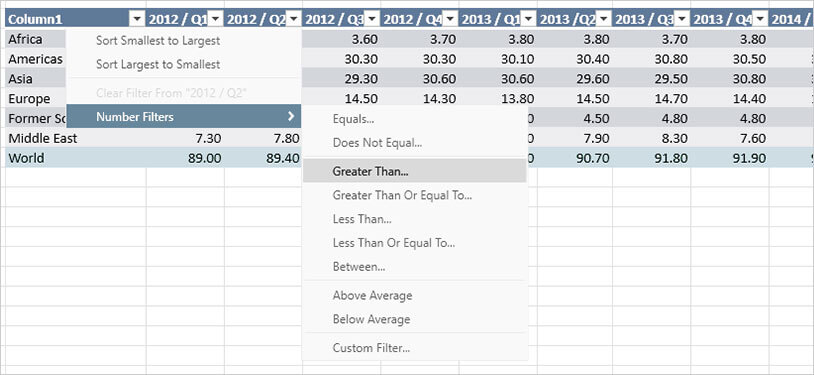
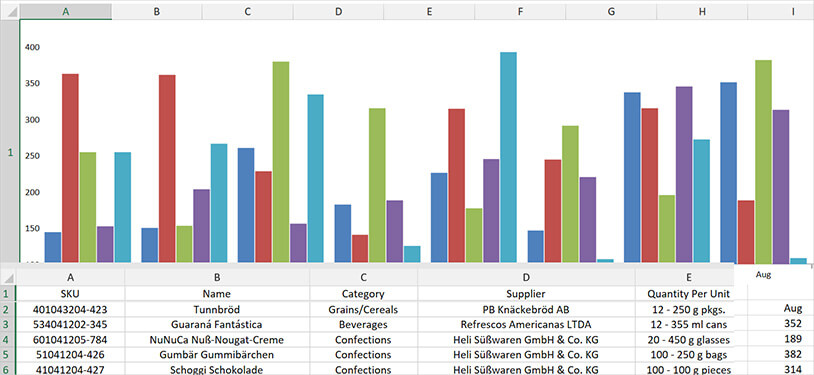
Chart Support
The WPF spreadsheet renders charts in a worksheet and includes support for over 36 chart types, including area, column stacked, pie, exploded pie, bar stacked, and many more. When the dataset for the chart changes, the chart will update to reflect any changes in the values.