WPF Geographic Map
Create highly-detailed, thematic geographical maps using an innovative feature set that includes: custom shape templates, the ability to render polylines and polyshapes, Map Progression, Scatter Area Plots, an intuitive Overview Pane, and more.
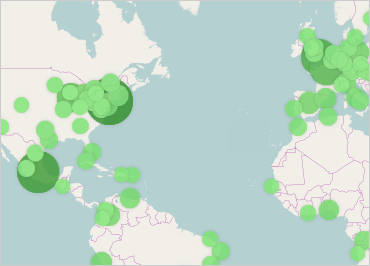
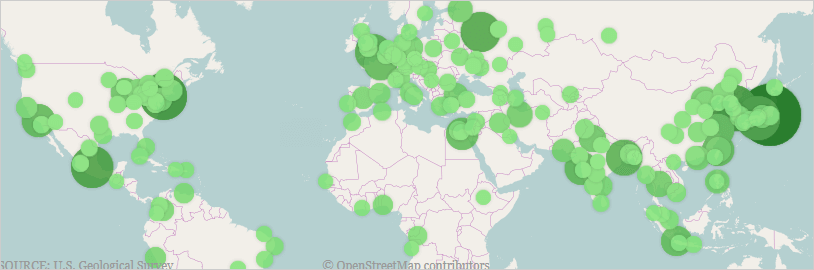
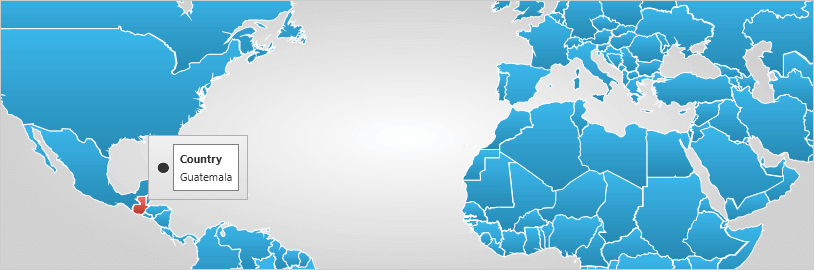
DOWNLOAD WPF SamplesProportional Symbol Series
Similar to the Scatter Area Map Series, the Proportional Symbol Series can show thousands of data points on a map where symbols of different sizes and colors are used to represent geospatial data associated with different areas or locations.
Geographic Tile Series and Multiple Tile Layers
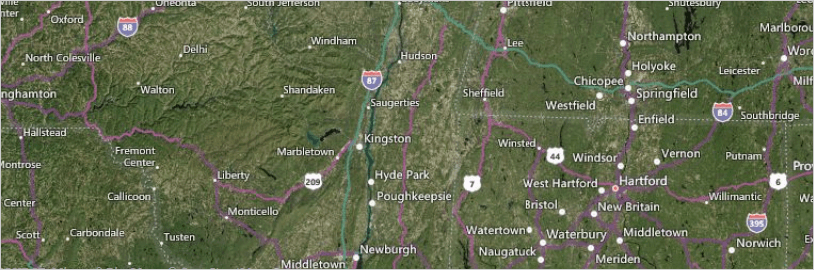
The Geographic Tile Series allows you to overlay multiple layers of geographic imagery, create cutouts to see underlying imagery, or use transparency to see through one layer of imagery while exposing the layer underneath. If you're a GIS developer, you can also load multiple tile data layers from Esri ArcGIS sources with the Geographic Map control.
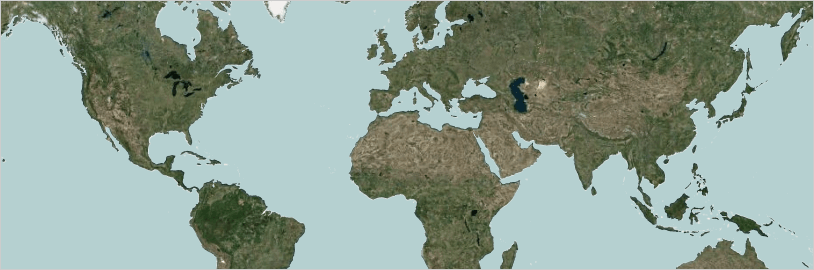
Support for Esri AcrGIS 256x256 Mercator Geographic Imagery
Developers can now use Esri tile sets within the Geographic Map control. 256x256 tile sets based on Mercator projections are supported and are compatible with the tile sets from the other supported providers, including OpenStreetMap, and Bing Maps. Other tile sizes and projections are not yet supported.
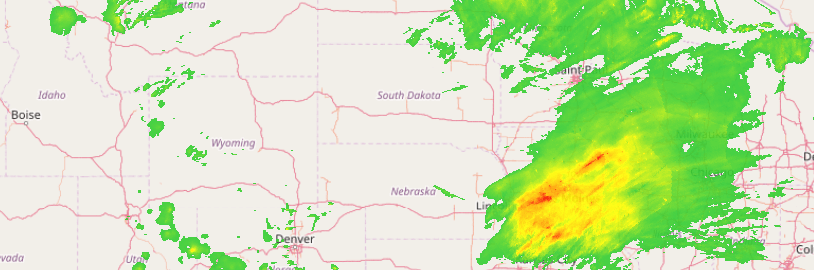
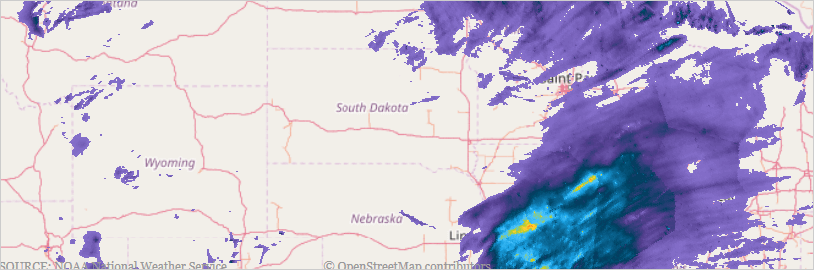
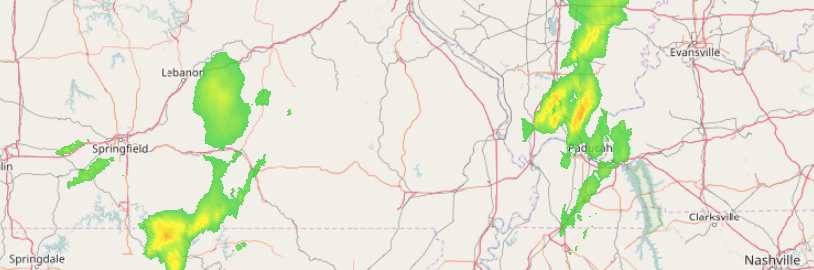
Scatter Area Plots
Show thousands of data points, such as precipitation measurements from thousands of weather stations in the USA, on a map,. The colors are smoothly interpolated around the shape by creating a triangulation of the original data and by applying a pixel-wise triangle rasterizer to determine where the rain was heaviest.
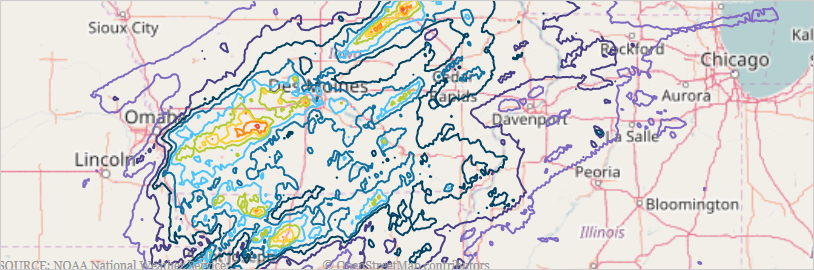
Contour Line Series
Like Scatter Area Maps, Contour Line Maps can be used to show thousands of data points by joining points of equal value such as elevations, precipitation levels, etc.
Geographic Shape Control
The shape control series renders shapes as templated controls instead of simple path elements, similar to the shape series.
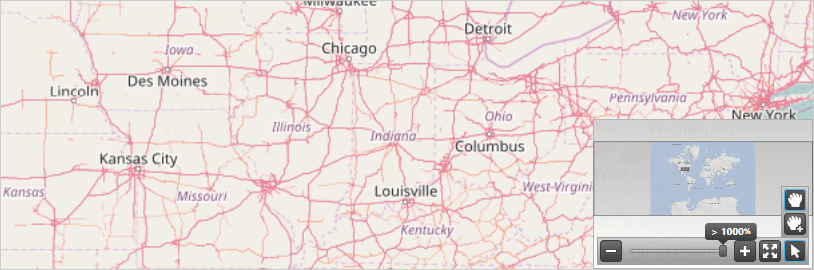
Map Overview Pane
Use the map overview pane to navigate the maps in an intuitive and easy-to-use display.
Triangulation
Some Geographic Series require a triangulation of XY+Value data in order to render, which can be a very time-consuming process when massive amounts of data points are involved. The new triangulation feature enables applications to avoid this computation at run-time by pre-triangulating the data and providing the triangulation to the GeoMap series.
Triangulation ITF Files
This new feature allows developers to save & load triangulation data to ITF files.
View Sample