Your Privacy Matters: We use our own and third-party cookies to improve your experience on our website. By continuing to use the website we understand that you accept their use. Cookie Policy
We use our own and third-party cookies to improve your experience on our website. They also allow us to analyze user behavior in order to constantly improve the website for you. Please review our Cookie Policy and cookie settings below.
When you visit any website, it may store or retrieve information on your browser, mostly in the form ot cookies. This information might be about you, your preferences, or your device and is mostly used to make the site work as you expect it to. The information does not usually directly identify you, but can give you a more personalized web experience. Because we respect your right to privacy. you can choose not to allow some types of cookies. However, blocking some types of cookies may impact your experience of the site and the services we are able to offer.
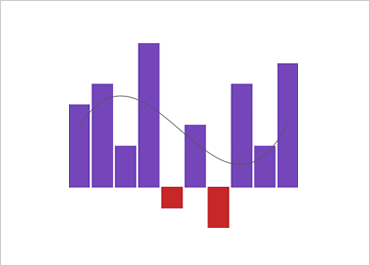
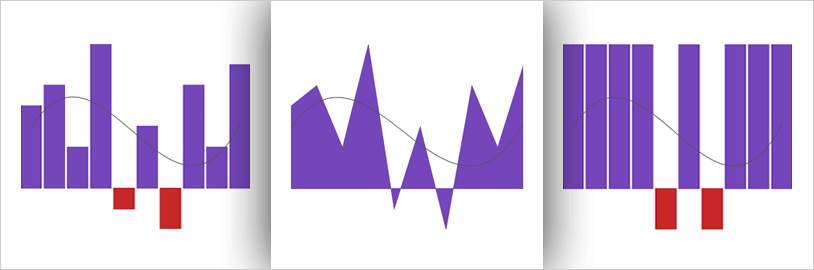
The Sparkline control is a data-intense, design-simple graphic that allows end users to spot trends, variations, and patterns in data in a clear and compact representation.
Many different trendlines can be applied to help users analyze their data, including: linear, weighted, quadratic, cubic, quartic, quintic, logarithmic, exponential, and more.
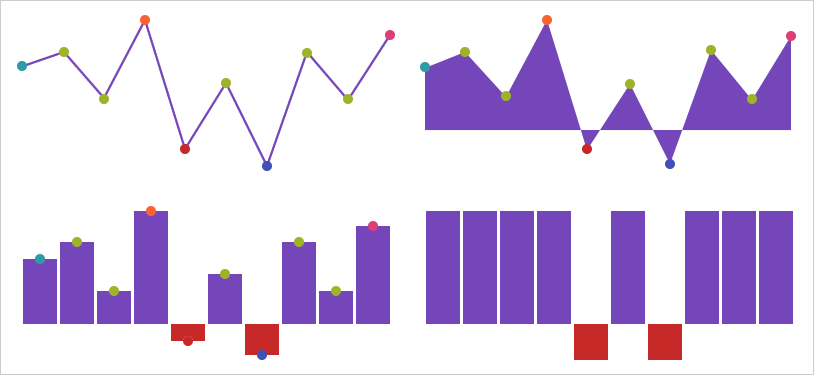
Markers Support
Display markers such as First/Last, High/Low, Negative, and Normal.
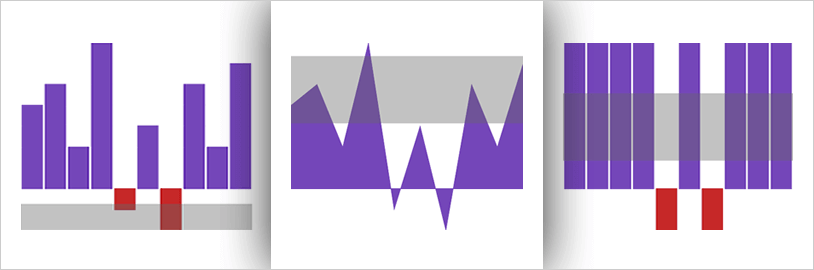
Adjust Ranges
Apply Normal, Minimum, and Maximum ranges to any Spark Chart type.