
WPF Data Chart
Render WPF charts with millions of data points that are capable of millisecond updates and spare nothing to achieve blazing speed. Enable heavy-duty data visualization and analysis on large volumes of data with high performance. An improved Date/Time Axis supports Axis Breaks, Dynamic Intervals and Dynamic Labeling.
DOWNLOAD WPF SamplesOver 75 Chart Types
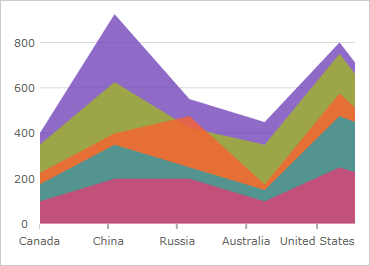
- Category Series (Line, Spline, Column, Area, Spline Area, Step Line, Step Area, Range Area, Range Column, Waterfall, and new Point Series)
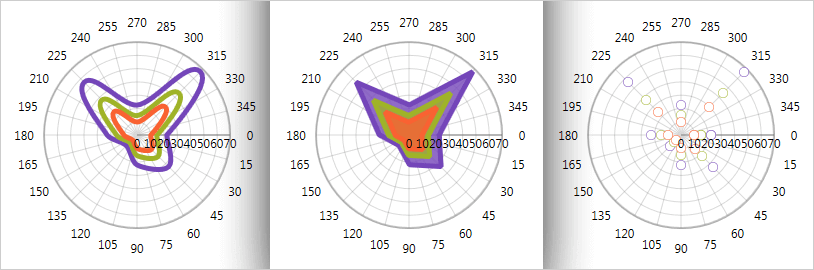
- Polar Series (Polar Line, Polar Area, Polar Scatter, Polar Spline, Polar Spline Area)
- Radial Series (Radial Column, Radial Pie, Radial Area, Radial Line)
- Scatter Series (Scatter, Scatter Line, Scatter Spline, Bubble, High Density Scatter, Scatter Area, Scatter Contour, Scatter Polyline, Scatter Polygon)
- Financial Price Series with Candlestick, OHLC Bar modes, and many financial indicators (e.g., EMA, MFI, SMATP, MACD).
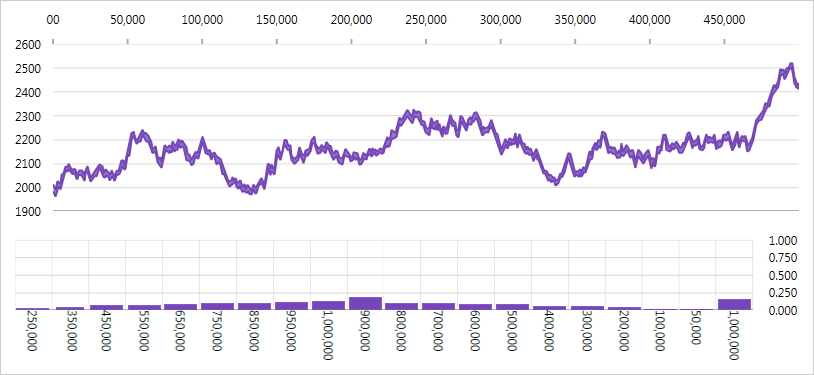
Real-Time Charting with Millions of Data Points
With this release, the speed and performance of our Data Chart have been significantly enhanced. This chart will display millions of data points and update itself every few milliseconds to handle your real-time feeds.
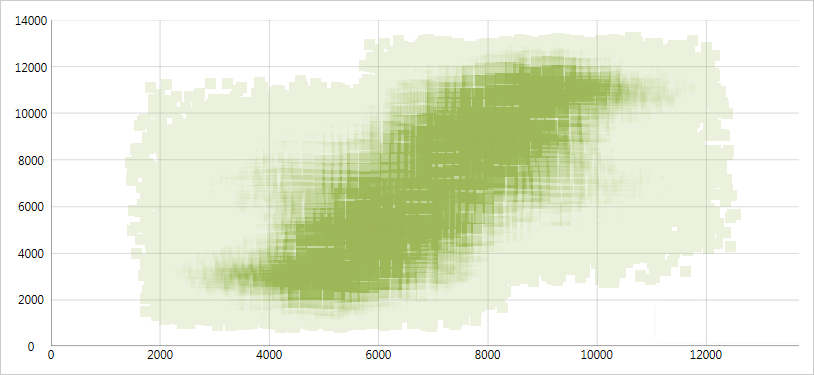
High-Density Scatter Series
Bind and show scatter data ranging from thousands to millions of data points without sacrificing performance. Change the series resolution to adjust the performance level of rendering while dealing with massive amounts of data points in the chart.
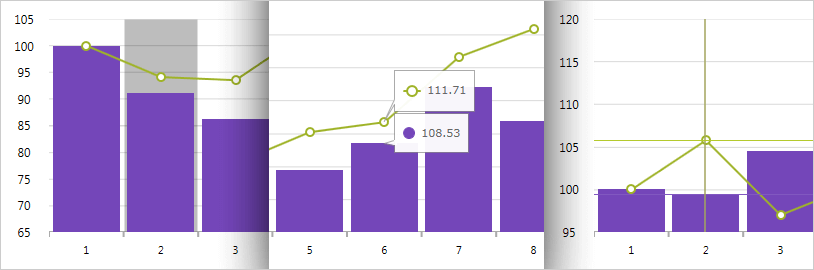
Hover Interactions
Activate a number of interactions when you hover over chart data series using the mouse or touch gestures. These hover interactions can display crosshairs or bar/column highlights to snap to actual data points. Attach tooltips to the hover interactions and lock them on crosshairs or to axes.
Modular Design
The WPF data chart control is designed for modularity of axes and chart series. Multiple axes and multiple chart series are supported.
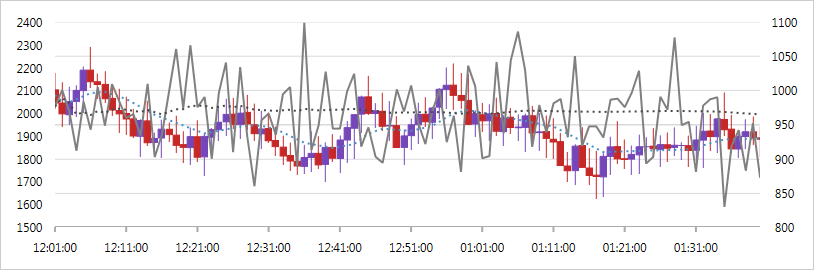
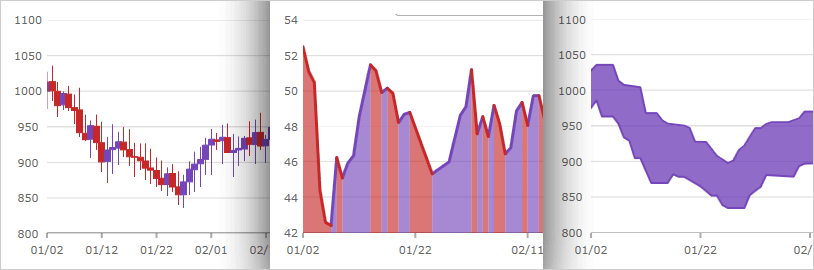
Financial Charting
Financial charting scenarios, with support for both Candlestick and OHLC bar chart, and many built-in technical indicators (like Moving Averages, Bollinger Bands, Money Flow Index, MACD, Wilder's RSI) are supported.
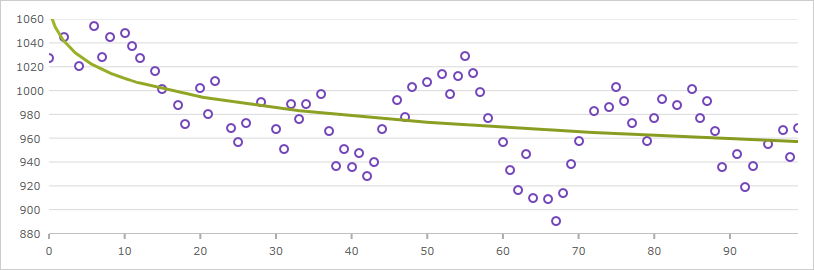
Trend Lines
Support for multiple types, including linear (x), quadratic (x2), cubic (x3), quartic (x4), quintic (x5), logarithmic (logn x), exponential (ex), and power law (axk + o(xk)) trend lines.
Interactive Panning and Zooming
Use the keyboard, zoom bar, mousewheel, or drag-select any rectangular region with the mouse to zoom in for close-up look at data points. When you can show millions of data points, the individual points lose their identity when completely zoomed out.
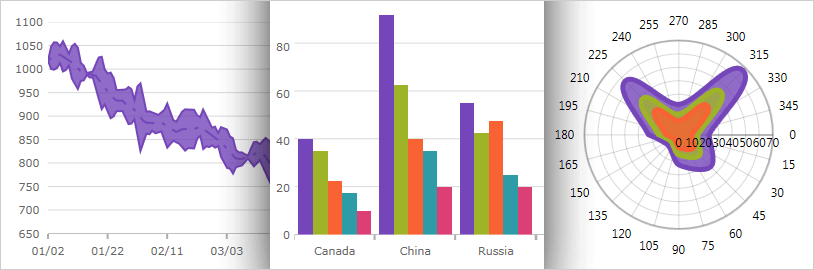
Scientific Charts
Polar series give insight to scientific data.
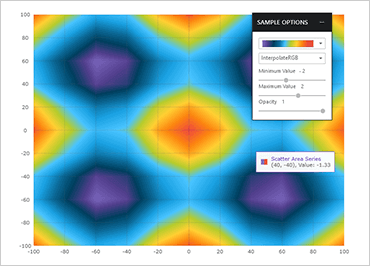
Scatter Area Series
The Scatter Area Series draws a colored surface, in a Cartesian context, based on a triangulation of X and Y coordinates with a numeric value assigned to each pixel of the surface. You can use this series to plot scientific data such as strength of magnetic field, 3-D shapes projected or flattened onto a 2-D plane, or correlation among three numeric columns in your data.
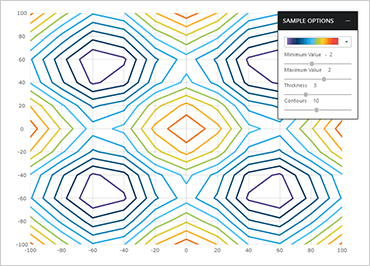
Scatter Contour Series
The Scatter Contour Series can plot the same data as Scatter Area Series, visualizing data using contour lines instead of interpolated surface area.
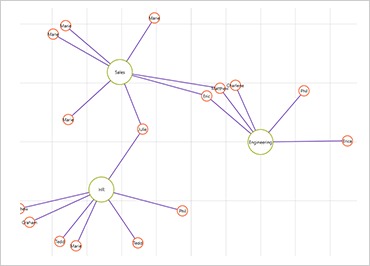
Scatter Polyline Series
The Scatter Polyline Series can plot outlines of custom shapes that are defined using a collection of collections of X/Y points. The series can show multiple connections between data points to indicate relegations or even build a view of networks.
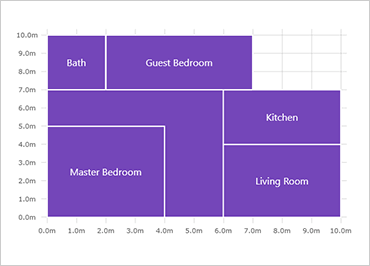
Scatter Polygon Series
The Scatter Polygon Series can plot custom filled shapes that are defined using a collection of collections of X/Y points. The series can be used to highlight regions in the plot area of the chart.
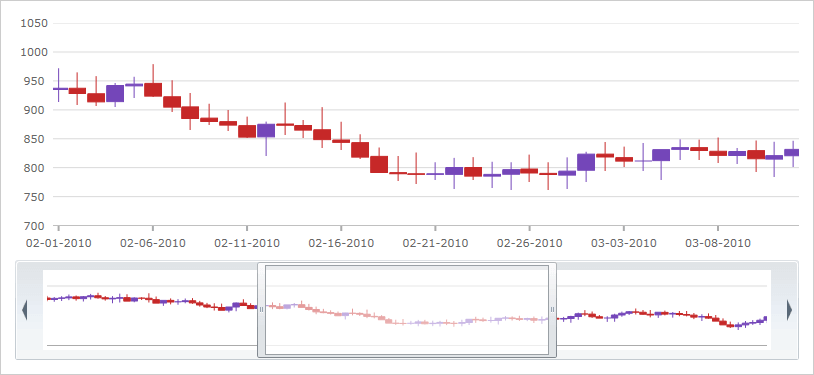
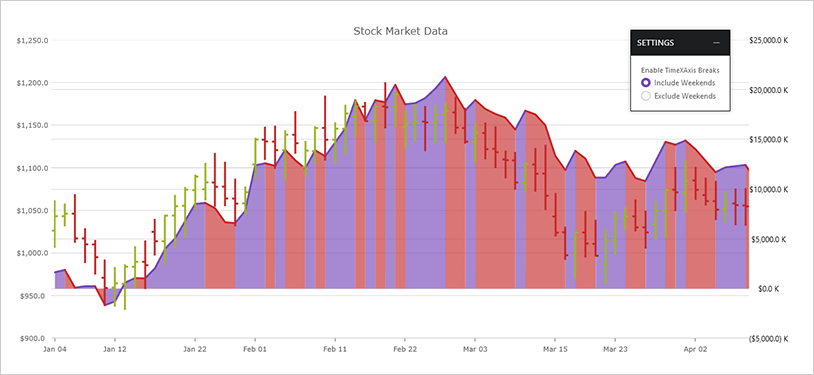
Date/Time Axis
The Date/Time Axis is an improved time axis that supports breaks, dynamic intervals, and dynamic labeling. The Breaks collection enables developers to configure the X-axis to omit dates in a range, such as weekends or other insignificant periods. The Intervals collection makes it easy to specify conditional label intervals based on the visible range of the axis, such as labels for each month when a year is visible. Label formats can also be configured according to the visible range.
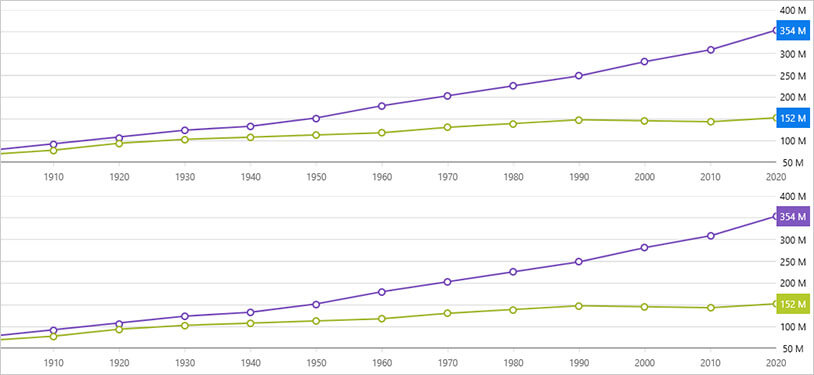
Final Values Annotation
Shows value of the last data point in your data source. Renders one colored box for each data source over Y-axis labels.
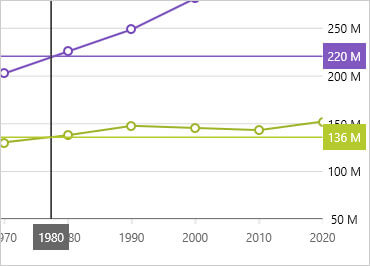
Crosshairs Annotation
Shows data point values at cursor location and renders these values in colored boxes over X and Y-axis labels.
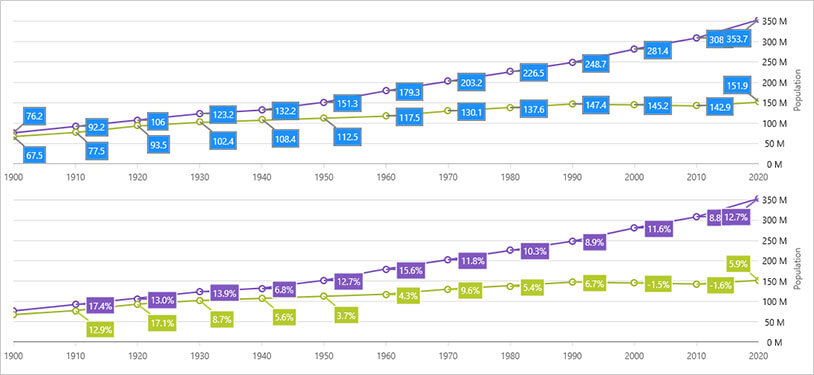
Callouts Layer
Annotate important data points or customize values in callout boxes based on your logic (i.e. calculate maximum values in your data source).
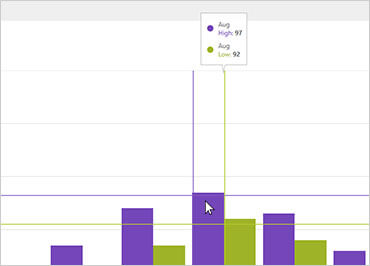
Category Tooltip Layer
Renders a combined tooltip for all series in a data category.
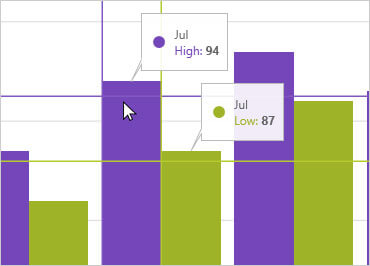
Item Tooltip Layer
Renders an individual tooltip for each series in a data category.