NEW Infragistics Ultimate 22.2 - Try Free for 30 Days!
Download Now
  • North American Sales: 1-800-231-8588
  • Global Contacts
  • My Account
Infragistics logo Infragistics logo
Menu
  • North American Sales: 1-800-231-8588
  • My Account
    • Sign In/Register
  • Design & DevelopmentDesign & Develop
    • Best Value Bundles
      Infragistics Ultimate $1,495 The only complete UX/UI toolkit for building high performance, modern web, mobile and desktop applications.
      Infragistics Professional $1,295 The comprehensive UI components library for web, mobile and desktop developers.
      Ignite UI $1,295 A complete library of UI components for building modern, data-rich and responsive web apps.
    • Web
      App Builder (New) Ignite UI Angular ASP.NET Core ASP.NET MVC Blazor jQuery React Web Components Ultimate UI for ASP.NET Web Forms
    • Desktop
      Ultimate UI for Windows Forms Ultimate UI for WPF
      Cross Platform
      Ultimate UI for Uno Ultimate UI for UWP Ultimate UI for WinUI Ultimate UI for Xamarin
    • Design to Code
      Indigo.Design App Builder (New) Design System & UI Kits
      Automated Testing Tools
      Test automation for Micro Focus UFT: Windows Forms Test automation for Micro Focus UFT: WPF Test automation for IBM RFT: Windows Forms
  • UX
    • Indigo.Design A Unified Platform for Visual Design, UX Prototyping, Code Generation, and App Development
    • App Builder Cloud-based WYSIWYG Drag & Drop Tool, Endless Theming options and Standards-Based Code Output
  • Business Intelligence
    • Reveal Easily embed beautiful data visualizations into your apps
    • Slingshot Empower everyone in your organization to use data to make smarter business decisions
  • Team Productivity
    • Slingshot Connect everyone you work with to data, project management, content and chats for better results.
    • SharePlus Secure, instant access to content and data on the go – with or without connectivity.
  • Learn & SupportSupport
    • Help & Support Documents
    • Blogs
    • Forums
    • Product Ideas
    • Reference Applications
    • Customer Stories
    • Webinars
    • eBook & Whitepapers
    • Events
  • Free Trials
  • Pricing
    • Product Pricing / Buy Online
    • Contact Us
WPF | Controls
  • Download Trial
Your Privacy Matters: We use our own and third-party cookies to improve your experience on our website. By continuing to use the website we understand that you accept their use. Cookie Policy
Close
  • Grids & Lists
    • Carousel Listbox
    • Data Cards
    • Data Carousel
    • Data Grid
    • Data Presenter
    • Pivot Grid
    • Property Grid
    • Spreadsheet
    • Tree Grid
    • Tree List
  • Charts
    • Category Chart
    • 3D Surface Chart
    • Data Chart
    • Doughnut Chart
    • Financial Chart
    • Funnel Chart
    • Pie Chart
    • Scatter Chart
    • Shape Chart
    • Sparkline Chart
  • Barcodes
    • Barcode
    • Barcode Reader
  • Data Entry and Display
    • Color Picker
    • Combo Box Editor
    • Formula Editor
    • Inputs
    • MultiColumn Combo
    • Rich Text Editor
    • Spell Checker
    • Syntax Editor
  • Data Visualizations
    • Diagramming
    • Gantt View
    • Geographic Map
    • Network Node
    • Org Chart
    • Treemap
    • Zoombar
  • Frameworks
    • Calculation Manager
    • Drag and Drop Framework
    • Excel Library
    • Math Library
    • Persistence Framework
    • Syntax Parsing Engine
    • Undo Redo Framework
    • Word Framework
    • WPF Reporting
  • Gauges
    • Bullet Graph
    • Linear Gauge
    • Radial Gauge
  • Interactions
    • Busy Indicator
    • Dialog Window
    • Slider
  • Layouts
    • Carousel
    • Dock Manager
    • Tab
    • Tile Manager
  • Menus
    • Context Menu
    • Menu
    • Outlook Bar
    • Radial Menu
    • Ribbon
    • Tag Cloud
  • Scheduling
    • Calendar
    • Month Calendar
    • Schedule
    • Timeline
  • Styling & Themes
    • Resource Washer
    • Theme Manager
  • Productivity Pack
    • Configurators
WPF Zoombar

WPF Zoombar

A virtual magnifying glass for WPF application users, xamZoombar embeds itself into charts and timelines so the user can zoom in, zoom out, and pan their view of the data from side to side.

DOWNLOAD WPF Samples

Intuitive Scrolling & Zooming

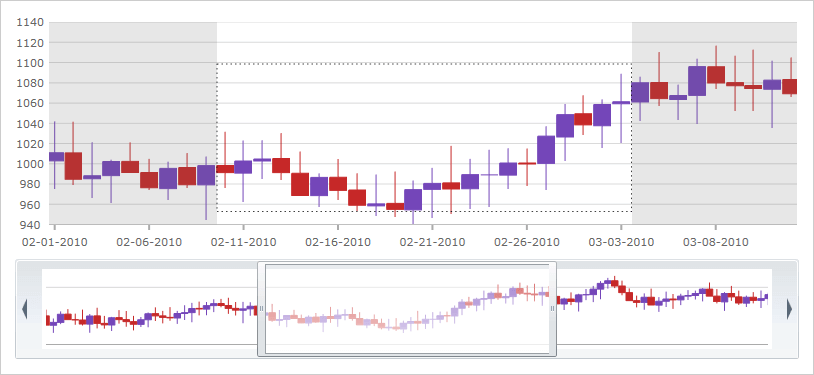
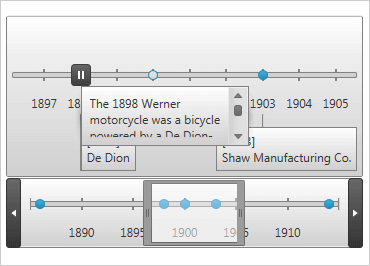
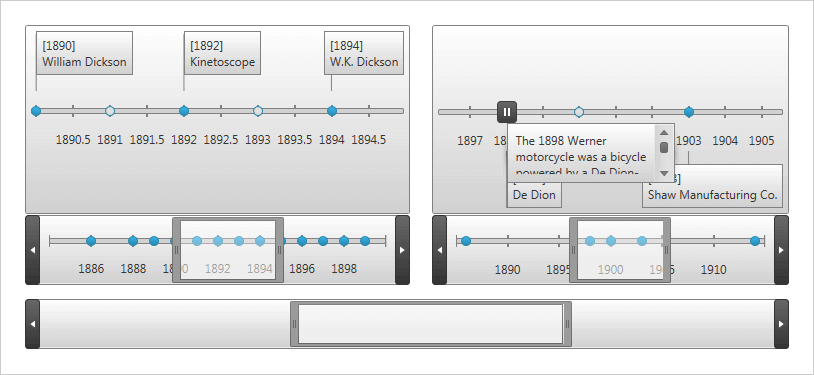
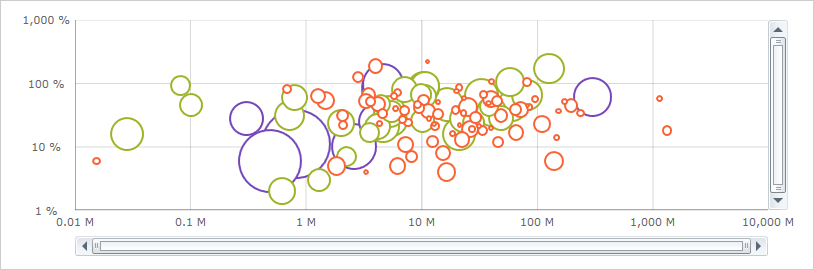
Dynamically change scale and scroll through ranges of data from regions on a chart to intervals along a timeline.

Intuitive Scrolling and Zooming

Multiple Orientations

Display vertically or horizontally and, in WPF controls like the xamDataChart™, integrate directly into the scrollbars.

Multiple Orientations

Panning & Zooming

Users can adjust the display scale by dragging the edges of the thumb pad to either make the current display cover a larger range (zoom out) or a smaller range (zoom in).

Panning and Zooming
  • Products
    • Design & Development
    • UX Pros
    • Business Intelligence
    • Team Productivity
    • View All
    • Free Trials
  • Learn & Support
    • Help & API Docs
    • Blogs
    • Technical Support Chat
    • Forums
    • Product Ideas
    • Submit a Request
  • My Account
    • Manage My Subscriptions
    • Support Requests
  • Corporate
    • About Us
    • Careers
    • Legal
    • News & Events
    • Partners
The best blogs, whitepapers, and other development resources
Unfortunately, Google has considered you a bot. If you have an account, please sign in to validate your status and fill form out again. Alternatively, please feel free to contact sales@infragistics.com to obtain the asset you were looking for or choose to schedule a demo of our products.
Thank you for subscribing. Look for an email from team@Infragistics.com for the latest news for Developers, UX, and Business Teams.
  • Privacy Policy(updated)
  • Cookies
  • Terms of Use(updated)
I.S. Partners SOC2 SEAL GDPR SEAL
© Copyright 2023 INFRAGISTICS. All Rights Reserved
Back to top of page