

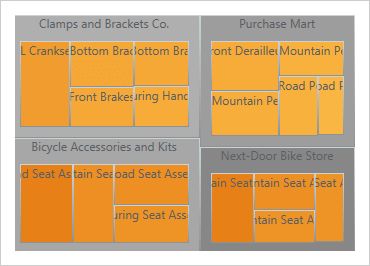
WPF Treemap
Show users the relative weighting of data points at more than one level with WPF treemaps (also known as heatmaps in the financial industry) supporting strip, squarified, and slice-and-dice algorithms.
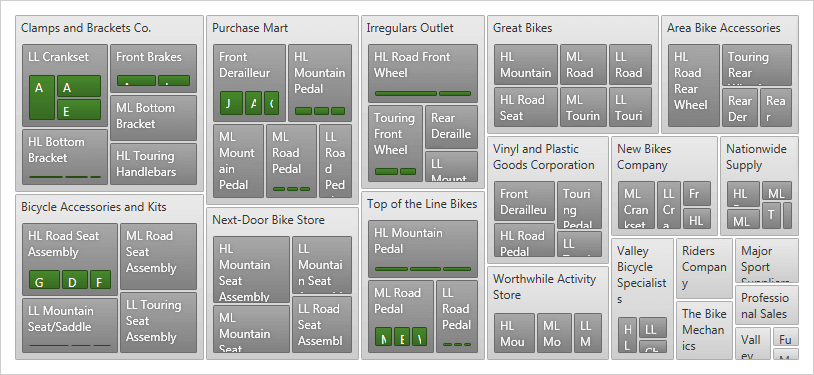
Strip, Squarified or Slice and Dicem
Treemaps (a.k.a., heatmaps in the financial industry) show the relative weight of hierarchical data relationships at more than one level with no drilldown required.
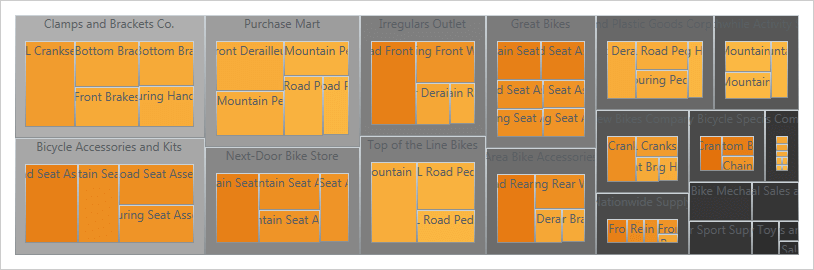
Effective Visual Analysis
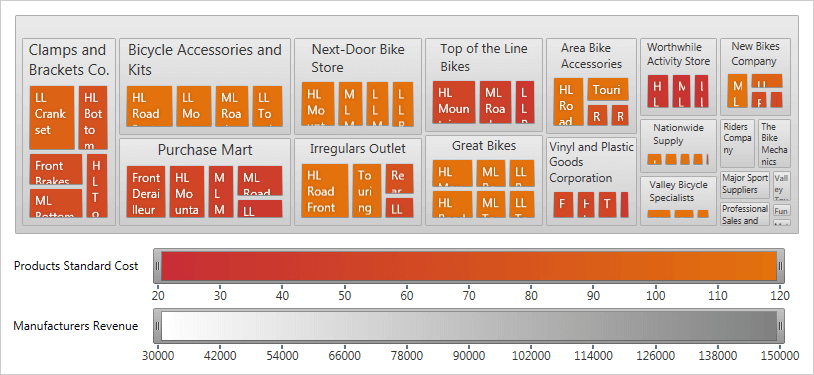
Communicate data more effectively in color with either a group-based organizational mechanism or a graduated scale-based mechanism similar to choropleth shading.
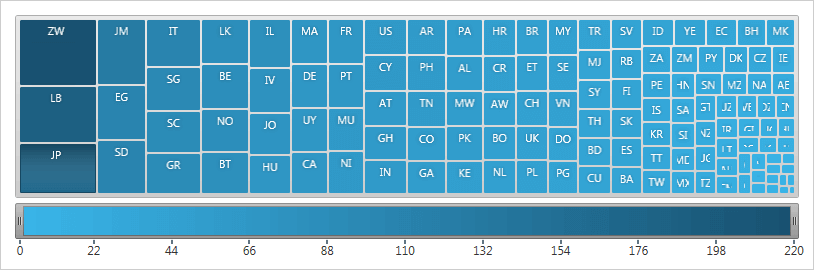
Large Data Sets
Treemap makes efficient use of space to display thousands of tree nodes on screen simultaneously.
Value Mapping
Color nodes based on their value within a range scale (similar to choropleth shading) or group all nodes with a similar value in the same color.